Small Business Planner & Goal Tracker
Goals, sales, cash and weekly priorities for a business of one, in a sheet and on paper.
$6.30Regular price $9-30%$9Buy now

1 / 8
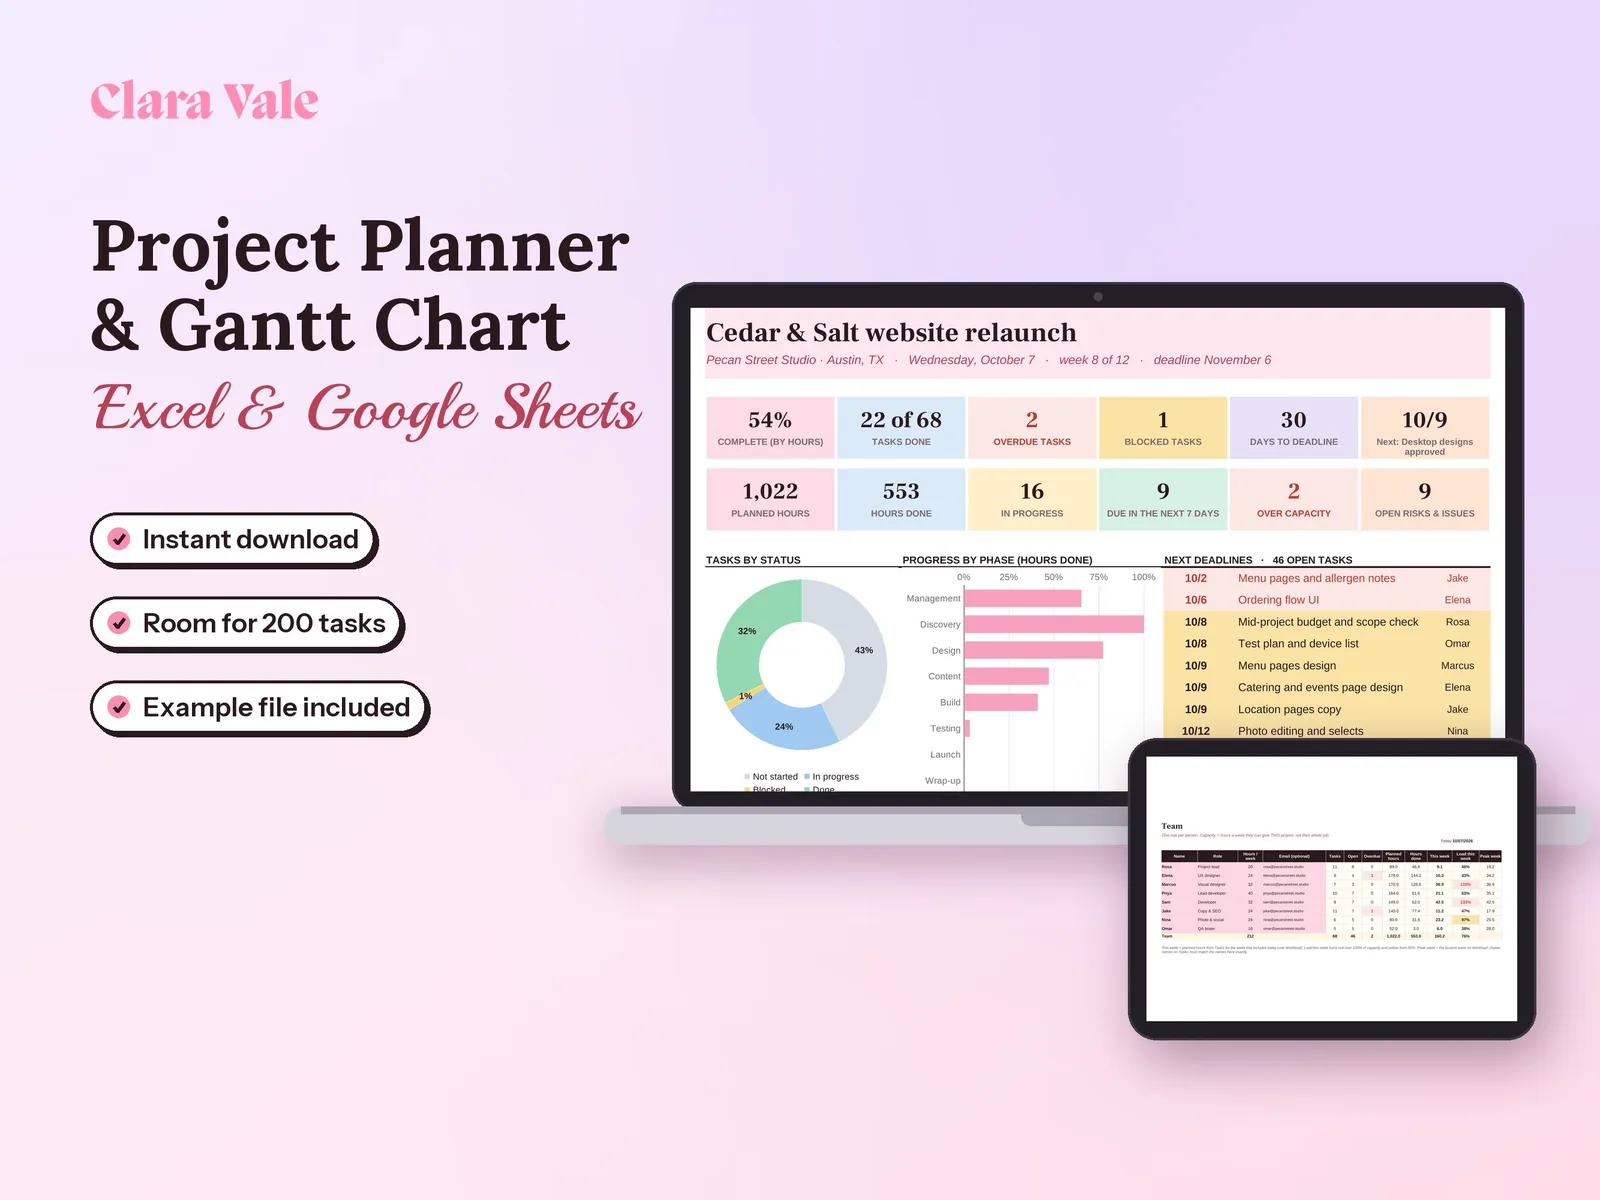
Plan the work, see who is overloaded and spot what is late, in one spreadsheet.
$6.30Regular price $9-30%$9
Fall Sale: 30% off at checkout, ends Nov 15.
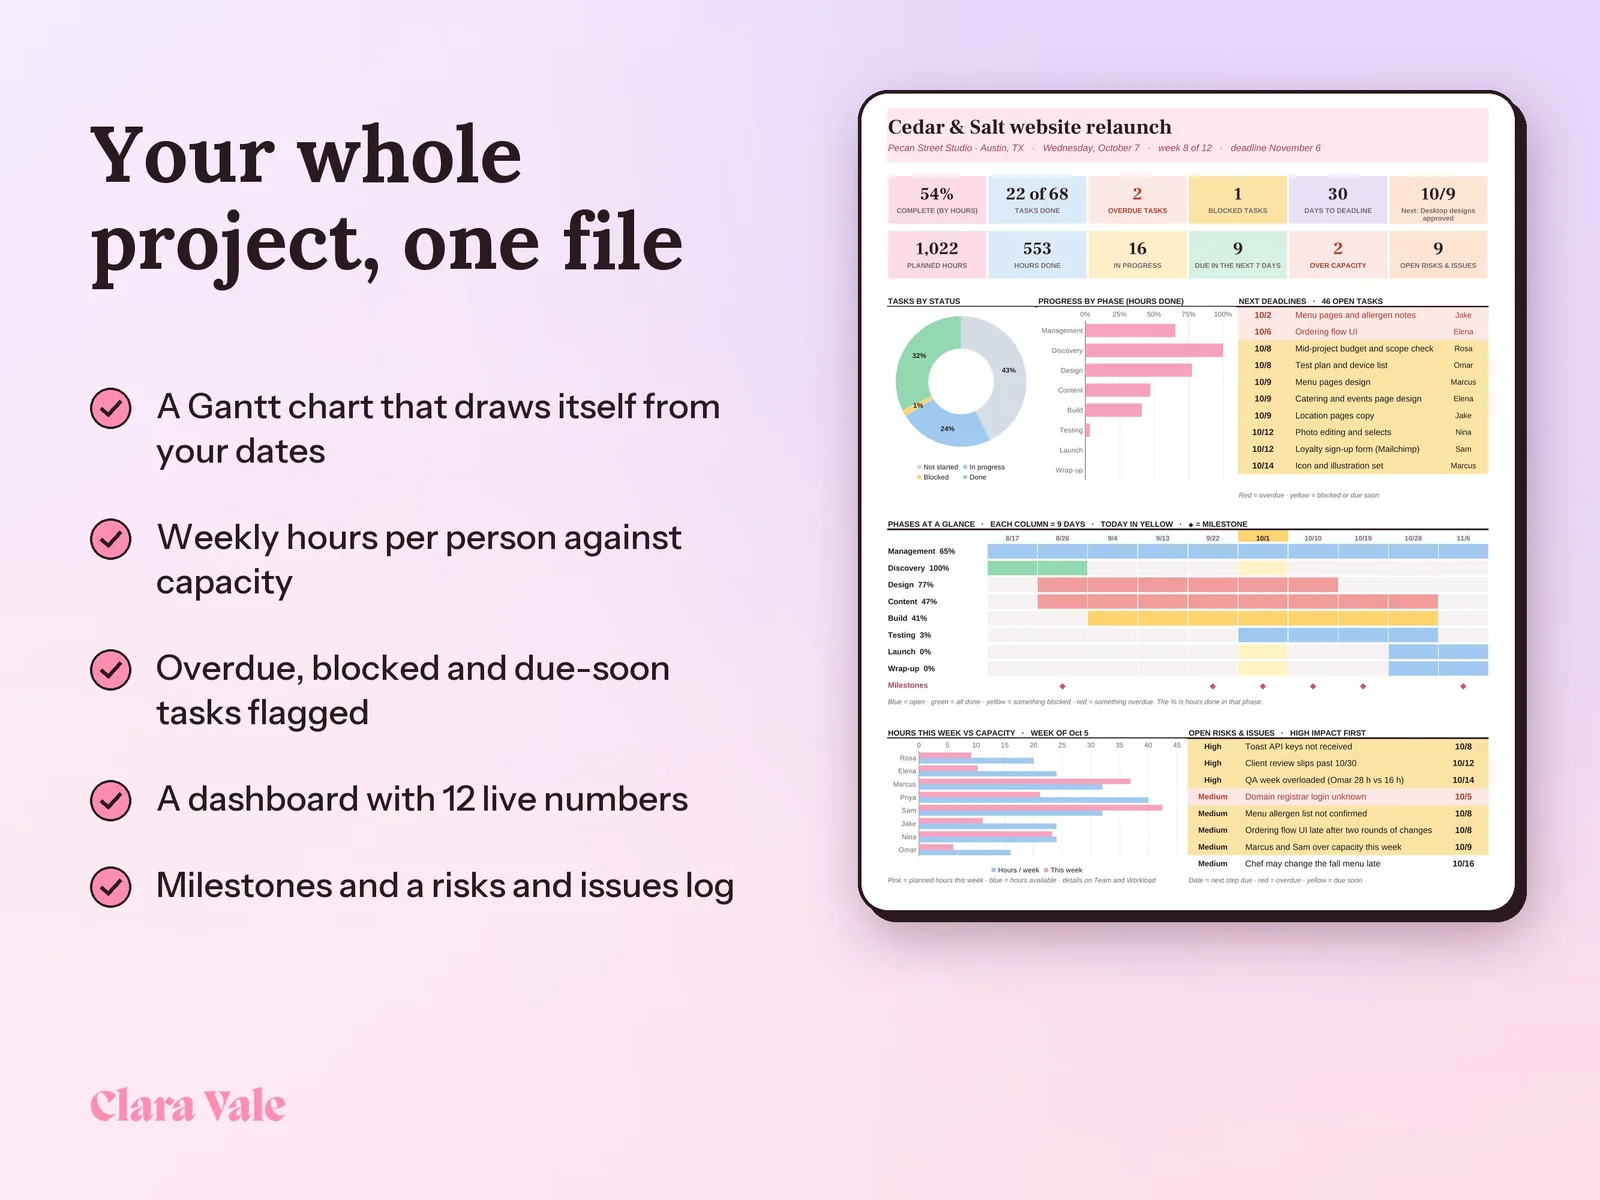
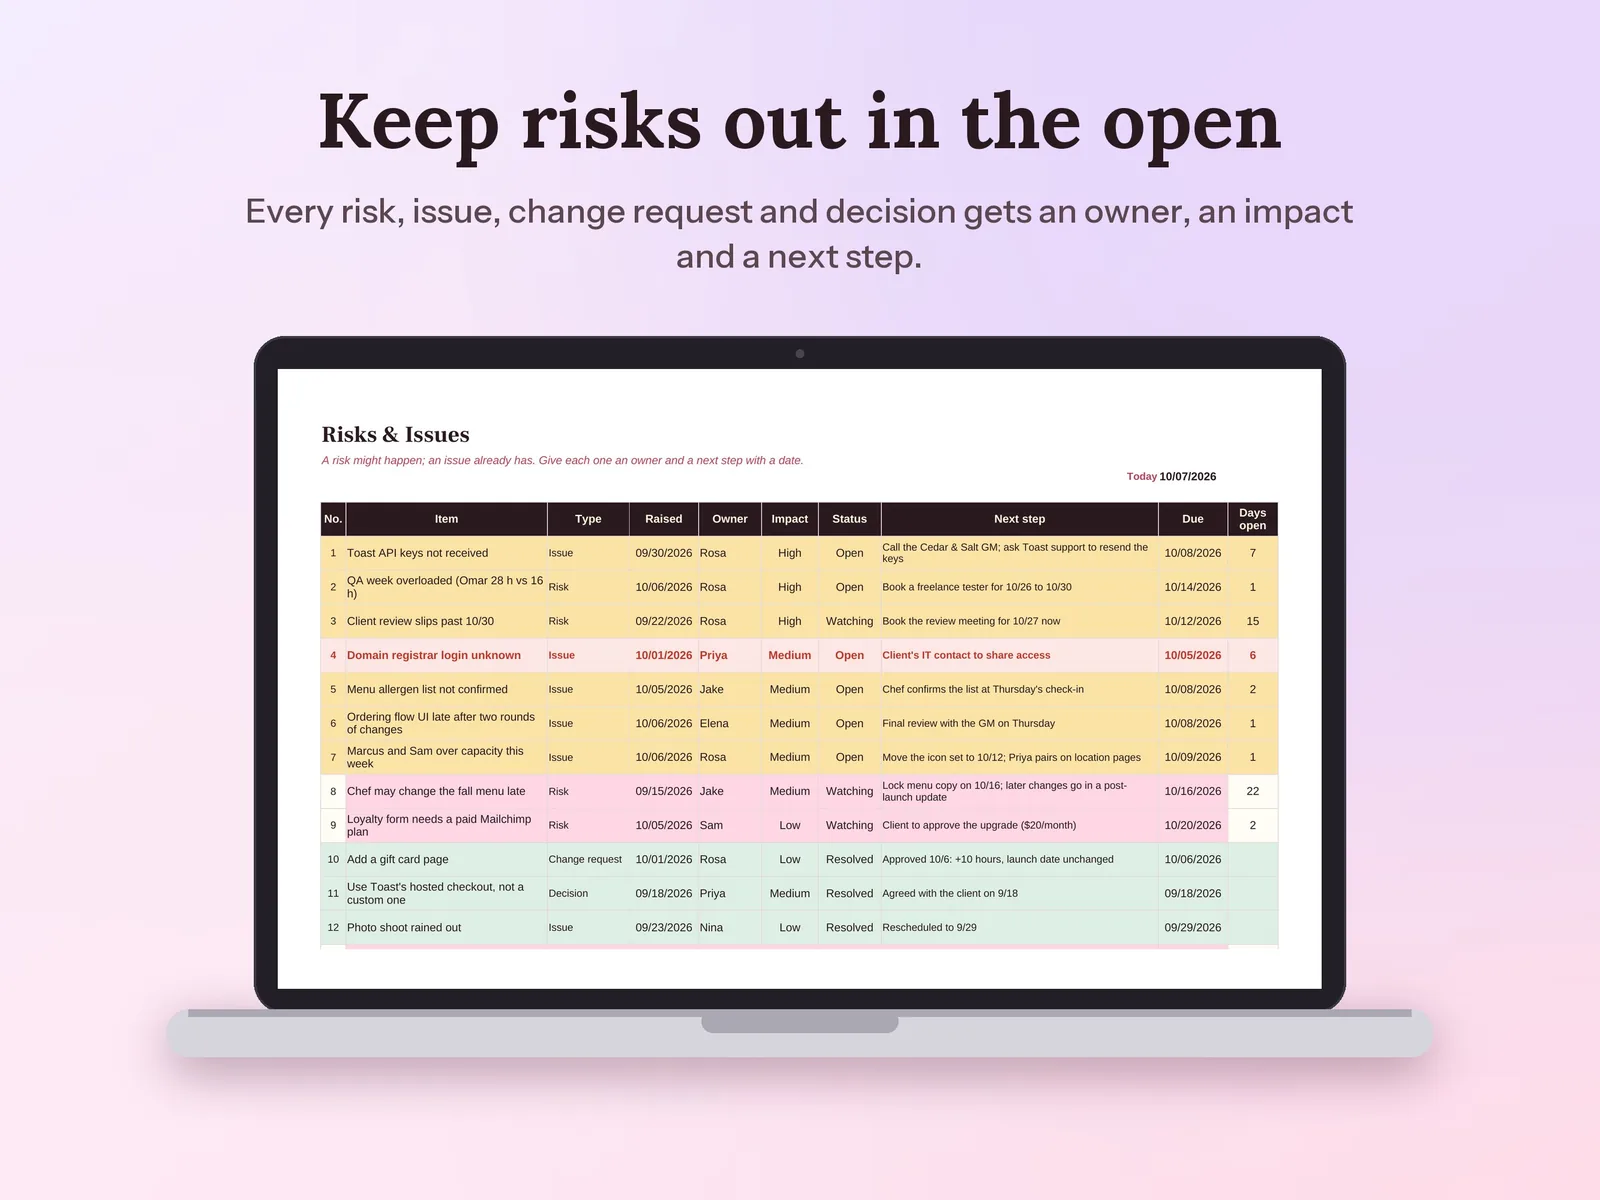
–Days––Hours––Min––SecA project planner and Gantt chart template for Excel and Google Sheets, built for small teams. List every task with an owner, dates, status and hours; the Gantt chart draws itself, a weekly workload view flags anyone over capacity, and a dashboard shows % complete, overdue and blocked tasks, the next deadlines and milestones. Works as a project tracker and task tracker in one file, with a filled-in example and a step-by-step PDF guide.
Format: Excel + Google Sheets · PDF guide
License: Personal & Business
Goals, sales, cash and weekly priorities for a business of one, in a sheet and on paper.
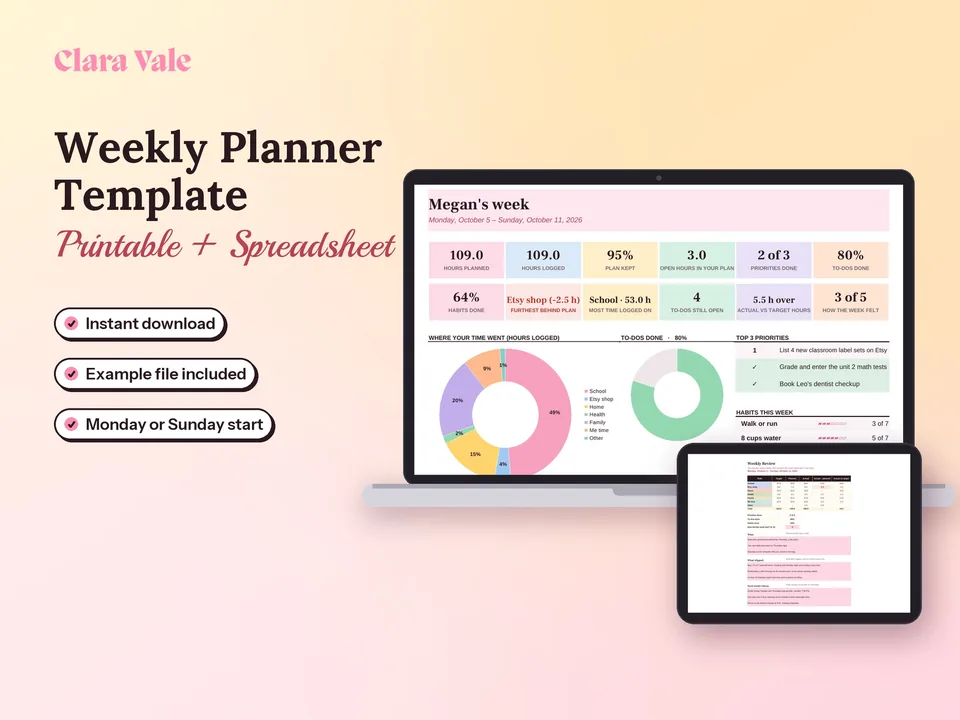
Fit a job, a side hustle and a life into one realistic week, then see where your time really went.
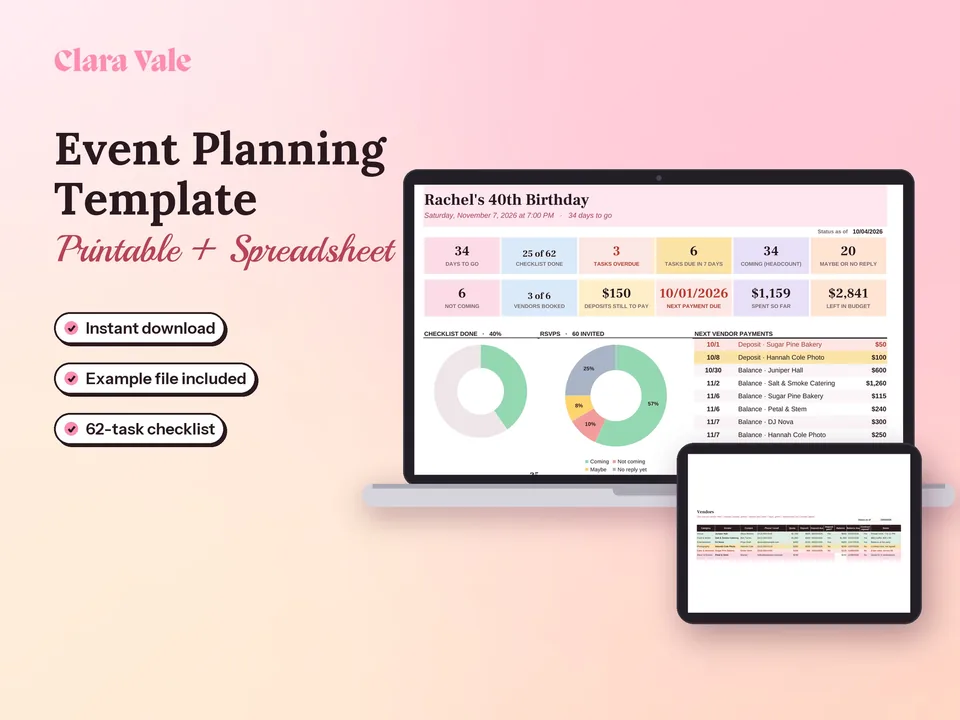
Plan the whole party in one place: tasks, vendors, guests, the schedule and the money.
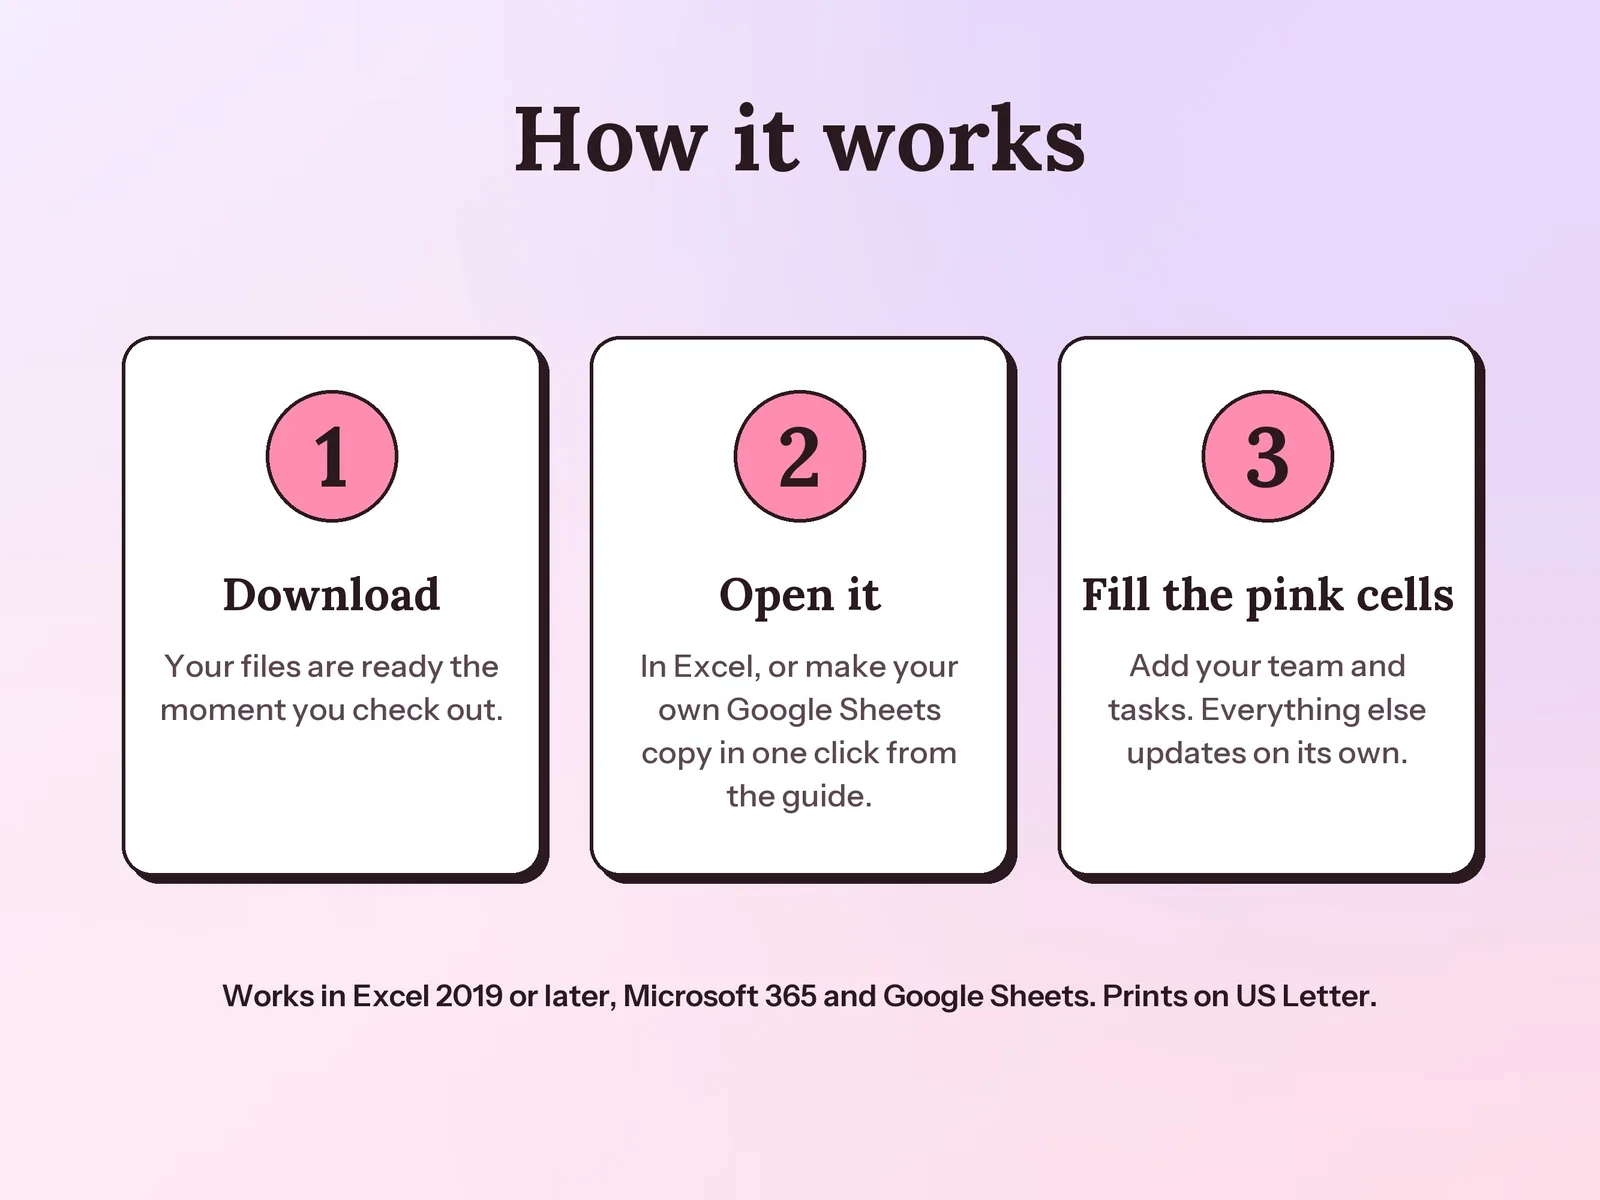
Yes. Upload the .xlsx file to Google Drive and save it as a Google Sheet; the guide shows the three steps. The Gantt bars, colors and drop-downs all work, and everyone you share it with sees the same plan. It also works in Excel 2019 or later and Microsoft 365.
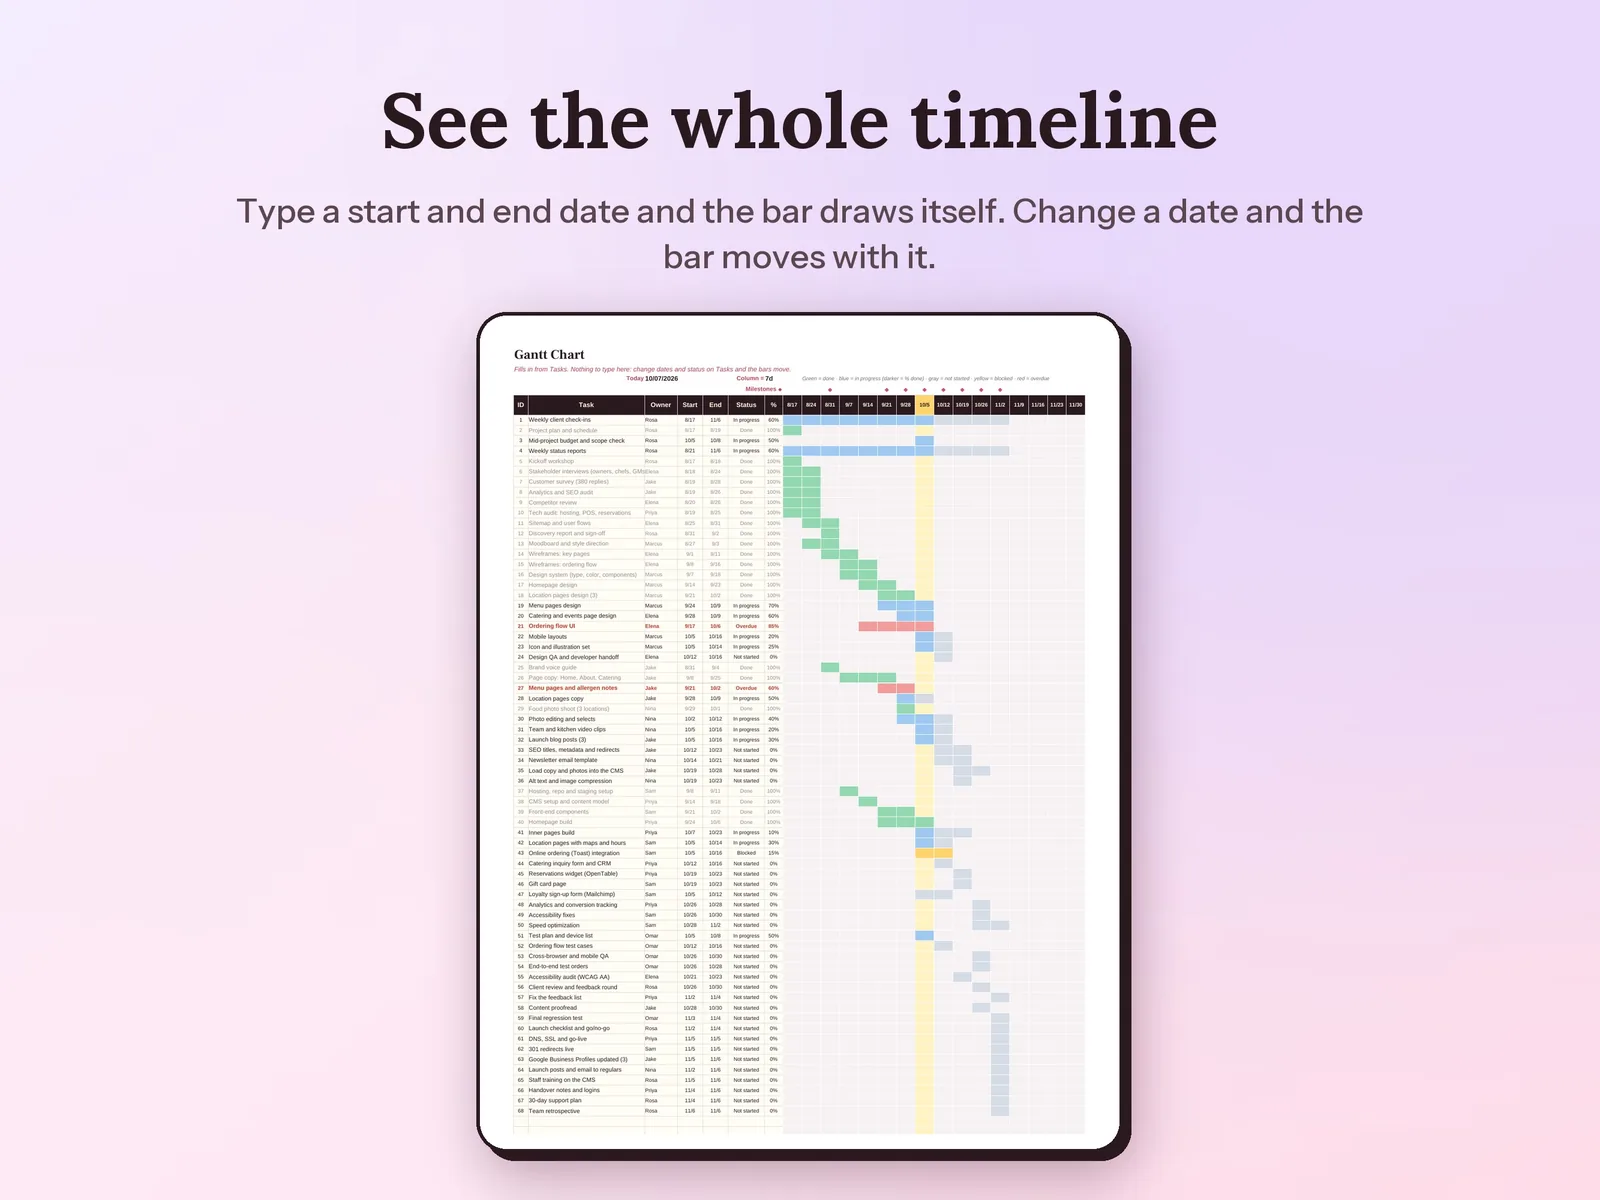
You type start and end dates on the Tasks tab and the bars draw themselves, one row per task, by week, day or two weeks. Green is done, blue is in progress, yellow is blocked and red is overdue. Change a date and the bar moves.
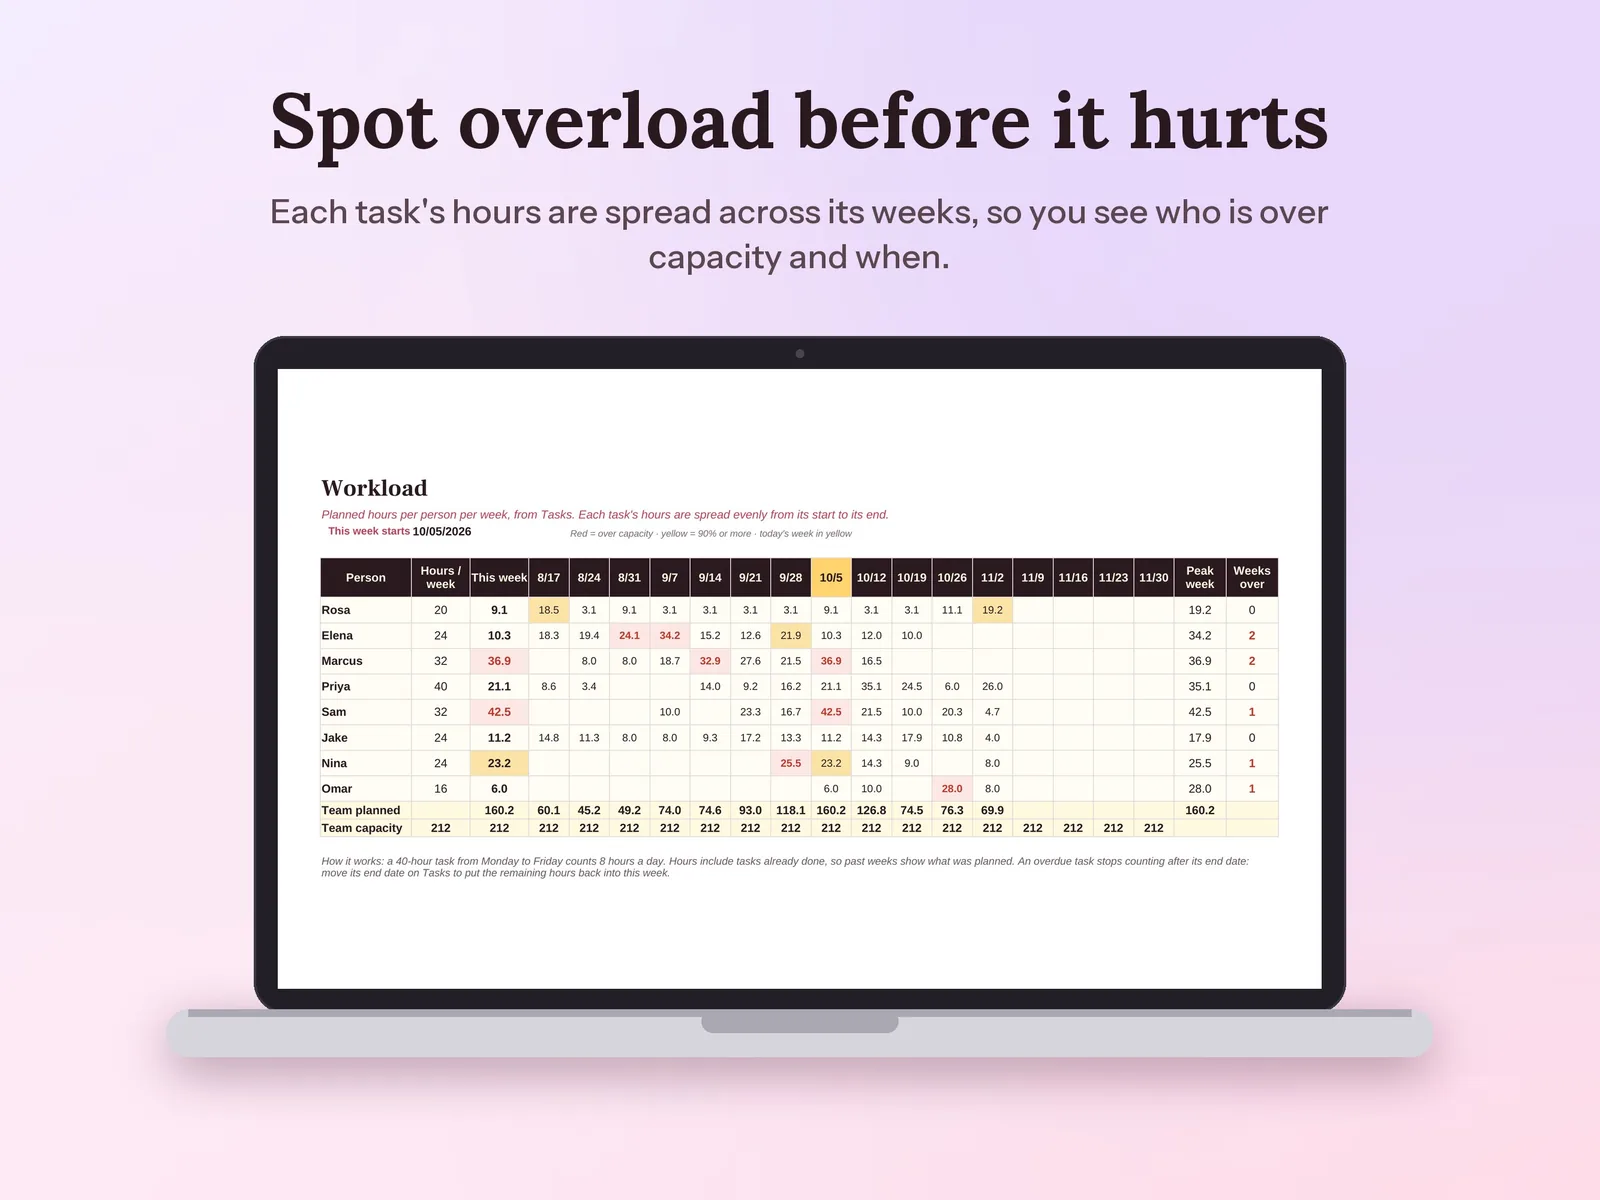
Each task's estimated hours are spread evenly from its start to its end date, then added up per person per week and compared with the hours they have for the project. Over capacity turns red, 90% or more turns yellow.
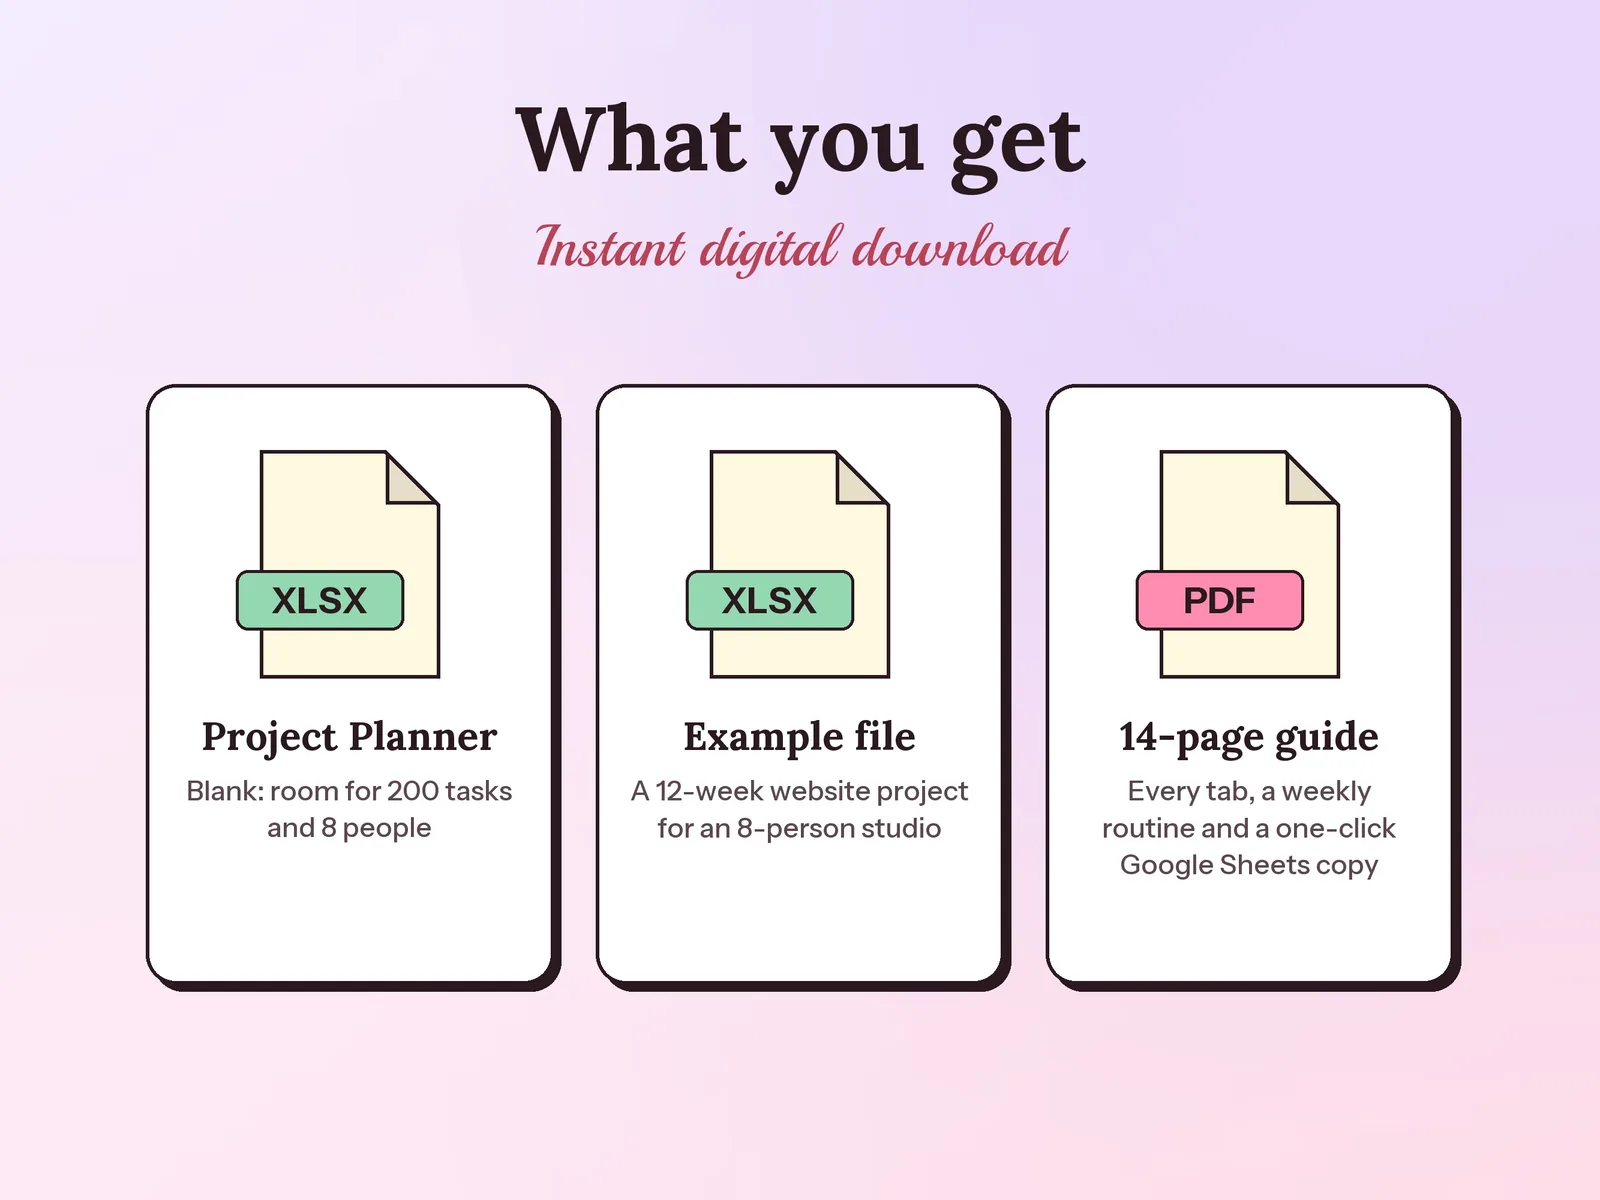
200 tasks, 8 people, 20 milestones and 40 risks or issues. You can unprotect a tab (no password) to add more rows.
A one-time download. No accounts and no per-seat price: the spreadsheet, example file and guide are yours to keep.